

Unit 22 · The footprint of a question
Tool phase · 45 minutes · 10th and 11th grade · for every project.
What you’ll do
Since you chose your project, every time something was about to be generated the same thing happened: before generating, the group decided how many generations the work justified, chose the lightest option that did the job and counted it on the board and on your card. Until today, that generation budget was justified by a principle —use what’s needed—, never by a number.
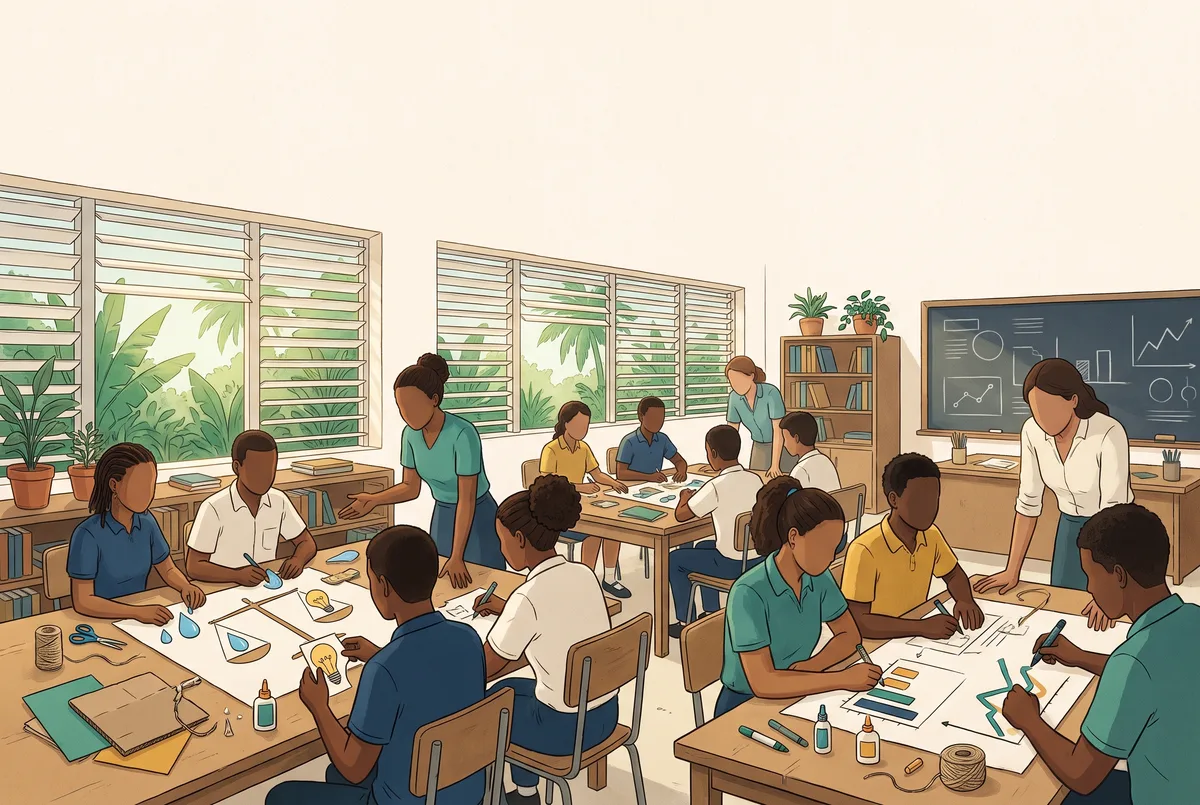
Today the numbers arrive. You add up your project’s count, estimate how much it would use in April, when someone else uses it, and make a one-page infographic that weighs that cost —in energy and water— against what it solves for the person with your problem.
Why it’s worth it
Every generation has a cost, even if you don’t see it. Deciding how much to use a tool is part of doing your project well. And you’ll learn to read a figure by asking where it comes from and what unit it’s in: a number without a source can scare a lot and inform nothing.
How the session goes
- Anticipate. Without screens, you add up from your card how many generations your project used, and of what kind: text, image, sound, playable page. You estimate how many it would use in April and in a month of use, and write “What I think will come out”.
- Act. The person guiding the session brings a sheet of figures verified in their original source, each with its source, its date and its unit, and reads it aloud. You do the calculation with your count. If the sheet compares kinds of generation, you see for the first time, with numbers, whether “text before image, image before video” holds; if it doesn’t include them, that’s said aloud. You decide your budget for the rest of the year.
- The infographic. By hand, or with an image generator only for the visuals: one generation at most, counted, after checking aloud that the card carries no one’s data. You put the figures in yourself: if you ask the machine for them, it makes them up.
- Reflect. You see the same figure without a source, without a unit and complete, and vote by knocking on the table on which one informs. Each infographic is described aloud and looked at against the criteria.
No screens. The whole first half, until you decide your budget, happens with no phone, no computer and no AI: you add up, calculate on paper, discuss and decide how many generations your project justifies from now to June, and whether you make the infographic by hand or with a single generation.
The criteria
- C1. Every figure carries its source and its unit.
- C2. It says how many generations —or, without AI, how many materials and how much time— your project justifies and why; in 11th grade, with cost and benefit on the same page and a decision.
- C3. Someone from outside understands it in thirty seconds.
If your project is without AI, or about AI
If your project is without AI, you do the same weighing of your own footprint: from your card you add up the materials and time your project has used since Unit 02 —sheets, pieces, hours, and the devices without AI if you used any—, estimate April’s, set them against what your project solves for its person and decide your materials and time budget for the rest of the year, with a reason. Your infographic, by hand or with a tool without AI, joins the listening just the same, and the question for you is: what did you decide, and why? If your project is about AI, this infographic can be part of it. And if you didn’t keep the count on your card, you rebuild it with your team and the board from earlier Units, and say so on the infographic.
If no figure could be verified in time, the Unit runs anyway, without figures: your count, your estimate and the weighing stay, and C1 becomes “it says which figure would be needed and where to look for it”.
To look at first
- The footprint of a question: an infographic that only uses figures from primary sources.
- The library assistant, for the instruction for the visual part.
What this is, and what it isn’t
This Unit’s design is original: a design position, not a research finding. This page gives no figures: the session’s figures come only from the sheet verified in primary sources before class. Nothing is graded, and no project is judged by its count: the aim is to decide, not to blame. If you make the infographic by hand, it joins the viewing just the same. Doing it without AI is a result too.